Tato stránka je k dispozici jen pro informativní účely. Některé služby a funkce nemusí být ve vaší jurisdikci dostupné.

How to Use Value at Risk (VaR) to Manage Your Cryptocurrency Assets

The crypto market is known for its extreme volatility, where the price of cryptocurrencies can vigorously fluctuate within a short period of time. In a market full of uncertainty, managing risks is therefore crucial for any traders, only by analyzing the possible risks of investments can traders determine the extent and occurrence ratio of potential losses in their portfolios.

To evaluate portfolio risk, we can make use of different tools in the market to calculate the “worse-case scenario” in trading, such as Value at Risk (VaR).

Understanding Value at Risk (VaR)

Dubbed the “new science of risk management”, Value at Risk (VaR) is a statistic that measures and quantifies the level of financial risk within a firm, a portfolio or a position over a specific time frame. It can be applied to measure the risk exposure of specific positions or whole portfolios.

A VAR statistic has three components: a time period, a confidence level and a loss amount (or loss percentage). Let’s look at an example of using VaR to calculate risks.

BTC/USDT: VaR Calculation

We will focus on the minute closing price of BTC/USDT between Aug 15–21, 2019 on OKX. This calculation assumes that log-returns are normally distributed.

Step 1: Calculate the minute log-returns

Minute log-returns can be calculated based on the below formula:

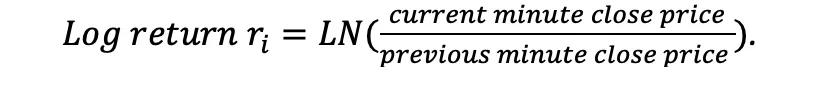
Here we use the logarithm of returns instead of price returns. The benefits of using log-returns, versus prices, is log-normality: assuming the prices are distributed log normally, the log return is conveniently normally distributed, which is handy given much of classic statistics presumes normality.

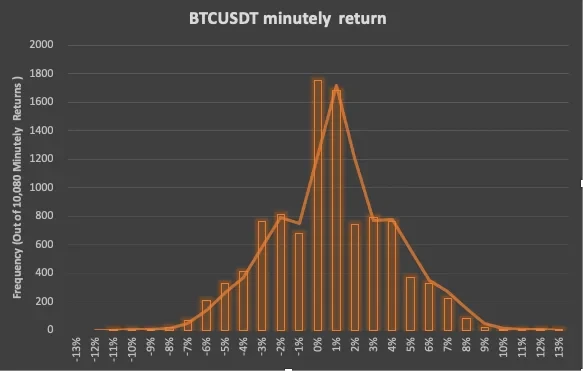
We can then divide the log-returns into 27 intervals: (-14%, -13%), (-12%, -11%), …, (12%, 13%), count the number of minute returns for each interval and we get the following histogram:

Step 2: Calculate the average and standard deviation of log returns

We can then calculate the average and standard deviation of log-returns based on the formulas:

The average (µ) of 10,080-minute log-returns turns out to be 0.001083%, and the standard deviation (σ) is 0.03170.

Step 3: Calculate VaR based on confidence intervals of normal distribution

Assuming the returns are normally distributed, we can see where do the worst 5% and 1% lie on the normal curve. They show trader’s desired confidence, the standard deviation and the average from the below table:

The Verdict

There are two ways to understand the VaR calculation results:

  • With 95% and 99% confidence, we can expect that the worst loss will not exceed 5.23% and 7.38% respectively;
  • If we invest $10,000, we are 95% and 99% confident that our worst minute-loss will not exceed $523 (=$10,000 x -5.23%) and $738 (=$10,000 x -7.38%) respectively.

VaR is useful for calculating the maximum expected loss on an investment over a given time and a specified degree of confidence. Traders can apply VaR to determine the level of risk or potential losses of their trading portfolios easily and hence take necessary measures to control the risks.

Zřeknutí se odpovědnosti
Tento obsah je poskytován jen pro informativní účely a může se týkat produktů, které nejsou ve vašem regionu k dispozici. Jeho účelem není poskytovat (i) investiční poradenství nebo investiční doporučení, (ii) nabídku nebo výzvu k nákupu, prodeji či držbě kryptoměn / digitálních aktiv ani (iii) finanční, účetní, právní nebo daňové poradenství. Držba digitálních aktiv, včetně stablecoinů, s sebou nese vysokou míru rizika, a tato aktiva mohou značně kolísat. Měli byste pečlivě zvážit, zda jsou pro vás obchodování či držba kryptoměn / digitálních aktiv s ohledem na vaši finanční situaci vhodné. Otázky týkající se vaší konkrétní situace prosím zkonzultujte se svým právním/daňovým/investičním poradcem. Informace (včetně případných tržních dat a statistických informací), které se zobrazují v tomto příspěvku, slouží výhradně k obecným informativním účelům. I když jsme přípravě těchto dat a grafů věnovali řádnou péči, nepřebíráme žádnou odpovědnost za případné faktické chyby, opomenutí nebo názory, které v nich vyjádřené.

© 2025 OKX. Tento článek může být reprodukován nebo šířen jako celek, případně mohou být použity výňatky tohoto článku nepřekračující 100 slov za předpokladu, že se jedná o nekomerční použití. U každé reprodukce či distribuce celého článku musí být viditelně uvedeno: „Tento článek je © 2025 OKX a je použit na základě poskytnutého oprávnění.“ U povolených výňatků musí být uveden název článku a zdroj, a to např. takto: „Název článku, [místo pro jméno autora, je-li k dispozici], © 2025 OKX.” Část obsahu může být generována nástroji umělé inteligence (AI) nebo s jejich asistencí. Z tohoto článku nesmí být vytvářena odvozená díla ani nesmí být používán jiným způsobem.

Související články

Zobrazit více
okx learn default
Strategies

What are Carry trades — profit from cash-and-carry arbitrage

A carry trade is a relatively low-risk strategy that enables traders to profit from price differences between spot and futures contracts, or between spot and perpetual-swap prices. When a futures cont
10. 9. 2025
4
A Beginner’s Guide to Satoshi The Smallest Unit of Bitcoin
Bitcoin
Research
Strategies

Bitcoin vs gold: can digital gold beat its physical counterpart?

For centuries, gold has stood the test of time with little competition as an asset. To many, it’s the perfect asset. It's scarce and has become a sought-after metal. It’s long been a bastion of value and a hedge against economic turmoil. However, Bitcoin has challenged gold’s position in the last few years, leading some to call it “digital gold”.
10. 9. 2025
Začátečníci
18
trade responsibly
Strategies

Diversification 101: Understanding this risk management essential

If you took a poll of traders, we bet most would agree that diversification is fundamental to effective risk management. Building a portfolio of highly diversified assets allows traders to manage thei
10. 9. 2025
Začátečníci
1
Options trading generic thumb
Options

What is calendar call spread?

Call calendar spread trading is an options trading strategy that seeks to lock in gains from the changing prices over time of two options contracts with different expiry dates. Call calendar spreads are formed when a trader buys or sells a longer-dated call contract and takes the opposite position in a shorter-dated contract with the same strike price at the same time. Call calendar spreads are sometimes known as time-spreads or horizontal spreads. They become more lucrative as expiration approaches because of the time decay from both option contracts.
10. 9. 2025
Středně pokročilý
Bitcoin generic thumb
Bitcoin
Research

Comparing Bitcoin and S&P 500: charts and correlation to stocks

When it comes to building a portfolio for the long haul, traders often look towards long-standing, blue-chip stocks and exchange-traded funds tracking the Standard and Poor's 500 (S&P 500). Given their time-tested narrative and popularity among institutions, it's no surprise why such assets are top picks for anyone new to the world of traditional finance (TradFi).
8. 9. 2025
Středně pokročilý
18
Trading indicator generic thumb
Strategies

What is implied volatility: how IV impacts crypto option premiums

Did you know that you can still lose money when trading crypto options despite prices moving in your favor? That's due to the impact of implied volatility (IV) on option premiums. With highs and lows that you usually see on roller coasters, the implied volatility of and options can be tricky to navigate for anyone new to crypto options trading.
5. 9. 2025
5
Zobrazit více